Crime rate in Richmond, California (CA): murders, rapes, robberies, assaults, burglaries, thefts, auto thefts, arson, law enforcement employees, police officers, crime map
Crime rate in Richmond, CA
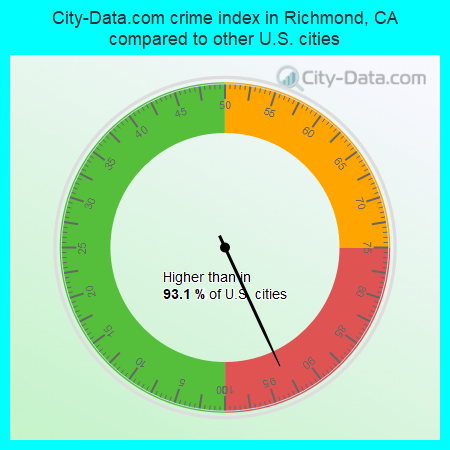
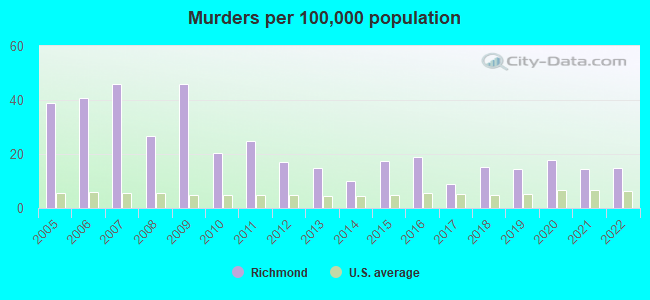
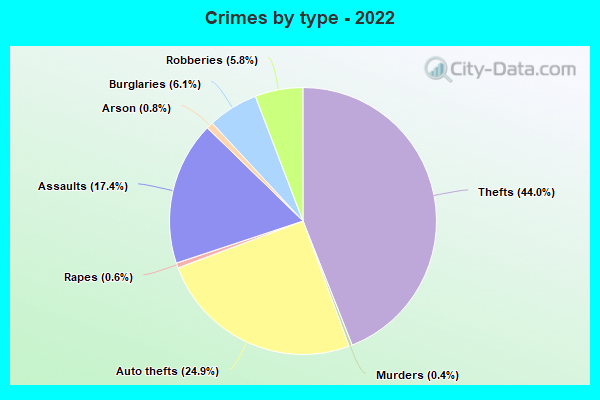
The 2022 crime rate in Richmond, CA is 386 (City-Data.com crime index), which is 1.6 times higher than the U.S. average. It was higher than in 93.1% U.S. cities. The 2022 Richmond crime rate fell by 13% compared to 2021. The number of homicides stood at 17 - an increase of 1 compared to 2021. In the last 5 years Richmond has seen decline of violent crime and decreasing property crime.See how dangerous Richmond, CA is compared to the nearest cities:
(Note: Higher means more crime)
(Note: Higher means more crime)
| Richmond: | 385.6 |
| San Pablo: | 340.1 |
| El Cerrito: | 315.1 |
| Albany: | 209.0 |
| Kensington: | 119.7 |
| Pinole: | 266.7 |
| Berkeley: | 475.2 |
| Hercules: | 91.7 |
| Tiburon: | 59.6 |
The City-Data.com crime index weighs serious crimes and violent crimes more heavily. Higher means more crime, U.S. average is 246.1. It adjusts for the number of visitors and daily workers commuting into cities.
- means the value is smaller than the state average.- means the value is about the same as the state average.
- means the value is bigger than the state average.
- means the value is much bigger than the state average.
According to our research of California and other state lists, there were 198 registered sex offenders living in Richmond, California as of April 19, 2024.
The ratio of all residents to sex offenders in Richmond is 555 to 1.
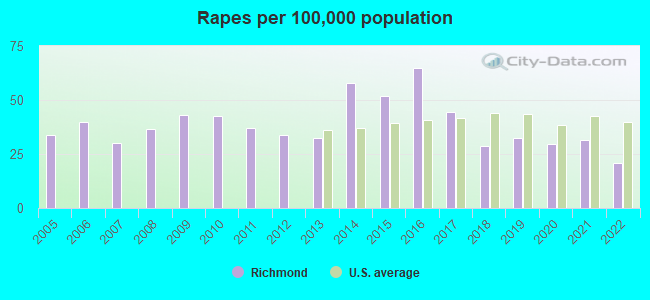
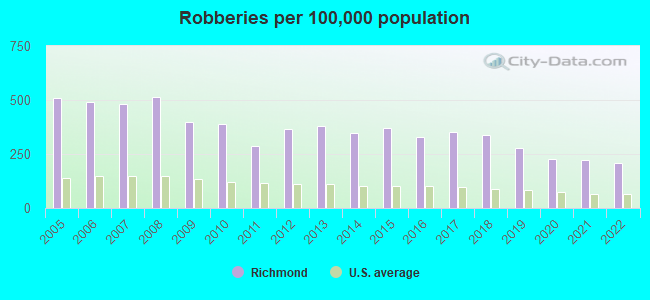
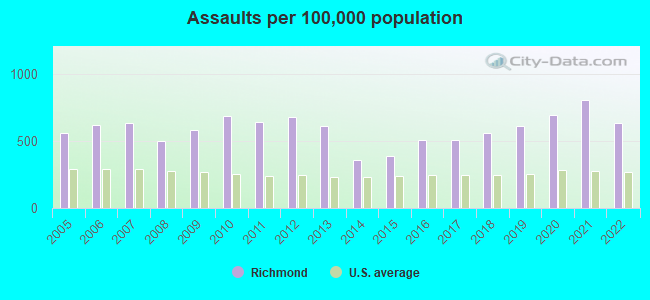
Violent crime rate in 2022
| Richmond: | 469.4 |
| U.S. Average: | 219.8 |
Violent crime rate in 2021
| Richmond: | 572.7 |
| U.S. Average: | 224.8 |
Violent crime rate in 2020
| Richmond: | 523.9 |
| U.S. Average: | 228.2 |
Violent crime rate in 2019
| Richmond: | 503.7 |
| U.S. Average: | 219.9 |
Violent crime rate in 2018
| Richmond: | 508.6 |
| U.S. Average: | 221.2 |
Violent crime rate in 2017
| Richmond: | 493.2 |
| U.S. Average: | 226.2 |
Violent crime rate in 2016
| Richmond: | 520.4 |
| U.S. Average: | 227.3 |
Violent crime rate in 2015
| Richmond: | 464.8 |
| U.S. Average: | 219.3 |
Violent crime rate in 2014
| Richmond: | 432.9 |
| U.S. Average: | 211.1 |
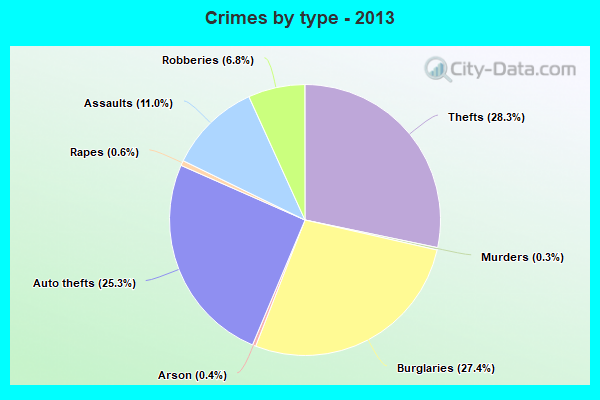
Violent crime rate in 2013
| Richmond: | 556.6 |
| U.S. Average: | 214.2 |
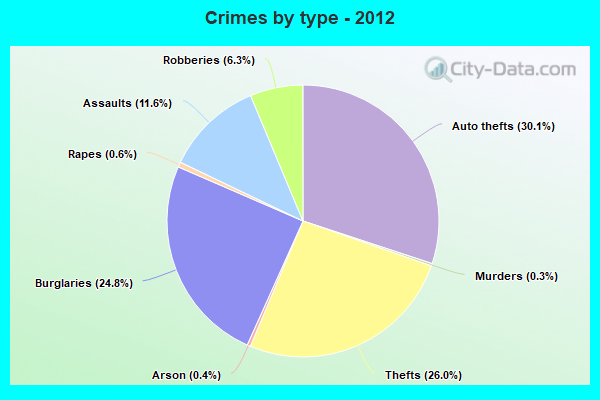
Violent crime rate in 2012
| Richmond: | 588.6 |
| U.S. Average: | 187.4 |
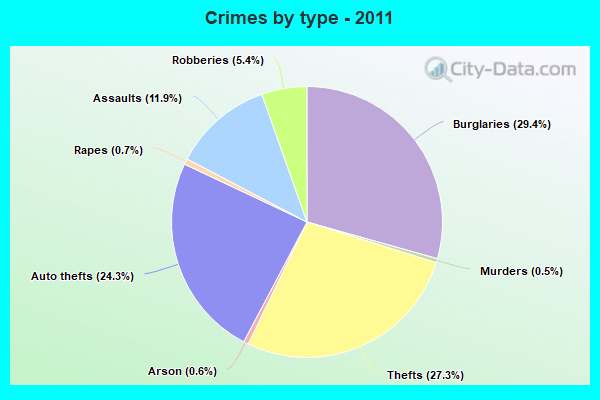
Violent crime rate in 2011
| Richmond: | 549.0 |
| U.S. Average: | 187.1 |
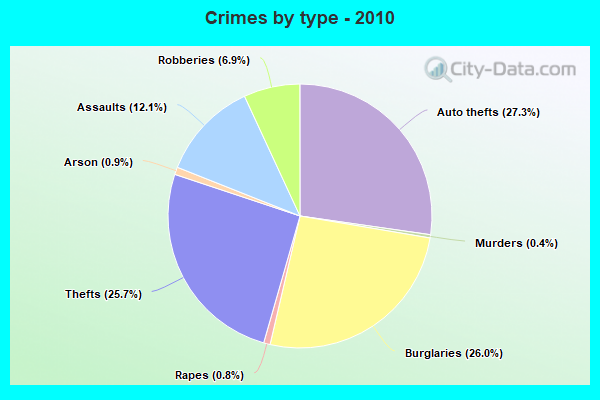
Violent crime rate in 2010
| Richmond: | 618.6 |
| U.S. Average: | 195.7 |
Violent crime rate in 2009
| Richmond: | 624.0 |
| U.S. Average: | 208.9 |
Violent crime rate in 2008
| Richmond: | 595.5 |
| U.S. Average: | 222.5 |
Violent crime rate in 2007
| Richmond: | 612.9 |
| U.S. Average: | 229.1 |
Violent crime rate in 2006
| Richmond: | 608.7 |
| U.S. Average: | 232.6 |
Violent crime rate in 2005
| Richmond: | 582.2 |
| U.S. Average: | 227.0 |
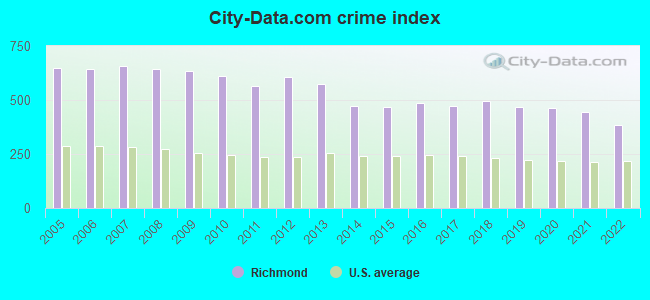
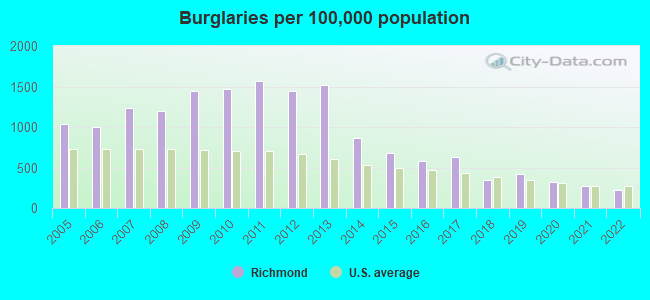
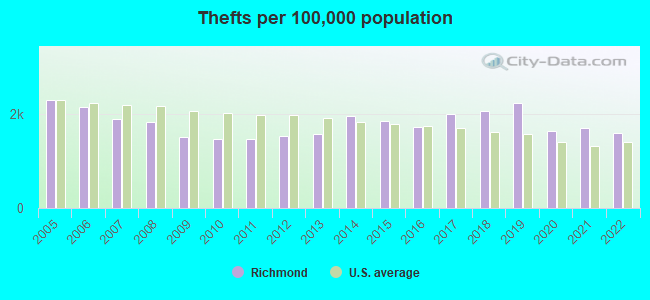
Property crime rate in 2022
| Richmond: | 258.3 |
| U.S. Average: | 166.5 |
Property crime rate in 2021
| Richmond: | 281.3 |
| U.S. Average: | 157.8 |
Property crime rate in 2020
| Richmond: | 348.4 |
| U.S. Average: | 169.6 |
Property crime rate in 2019
| Richmond: | 363.7 |
| U.S. Average: | 179.7 |
Property crime rate in 2018
| Richmond: | 399.7 |
| U.S. Average: | 190.2 |
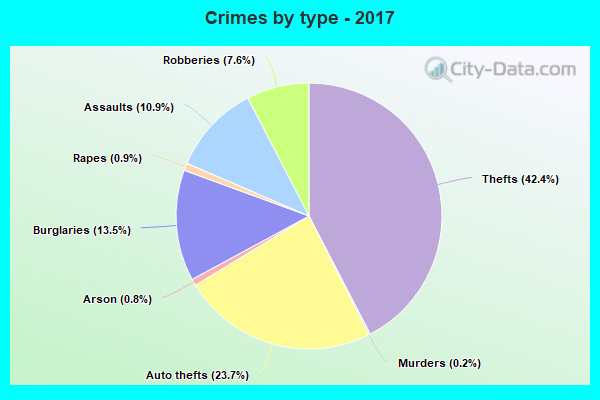
Property crime rate in 2017
| Richmond: | 391.9 |
| U.S. Average: | 206.4 |
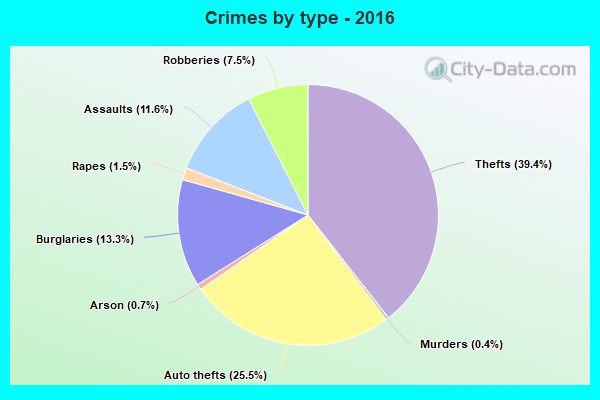
Property crime rate in 2016
| Richmond: | 369.2 |
| U.S. Average: | 216.6 |
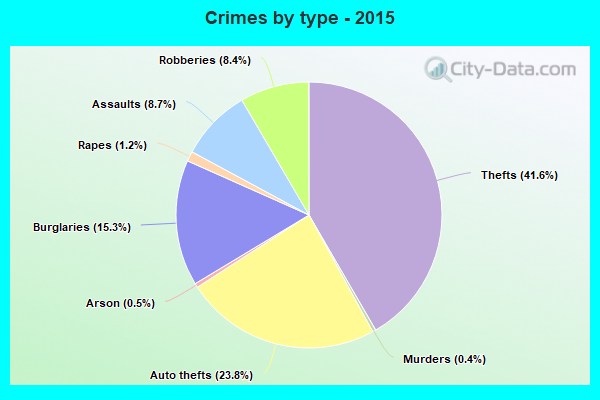
Property crime rate in 2015
| Richmond: | 383.9 |
| U.S. Average: | 221.5 |
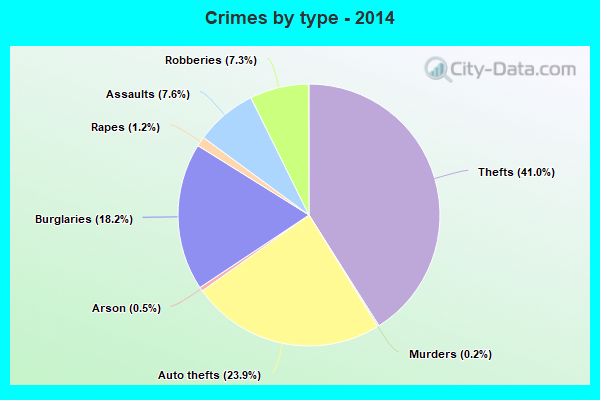
Property crime rate in 2014
| Richmond: | 440.3 |
| U.S. Average: | 230.8 |
Property crime rate in 2013
| Richmond: | 593.4 |
| U.S. Average: | 250.4 |
Property crime rate in 2012
| Richmond: | 628.1 |
| U.S. Average: | 267.3 |
Property crime rate in 2011
| Richmond: | 582.5 |
| U.S. Average: | 273.5 |
Property crime rate in 2010
| Richmond: | 596.8 |
| U.S. Average: | 276.4 |
Property crime rate in 2009
| Richmond: | 572.3 |
| U.S. Average: | 285.6 |
Property crime rate in 2008
| Richmond: | 610.6 |
| U.S. Average: | 302.2 |
Property crime rate in 2007
| Richmond: | 612.9 |
| U.S. Average: | 309.2 |
Property crime rate in 2006
| Richmond: | 573.0 |
| U.S. Average: | 317.3 |
Property crime rate in 2005
| Richmond: | 603.9 |
| U.S. Average: | 322.3 |
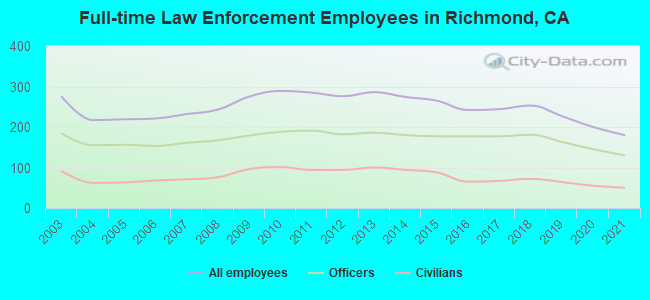
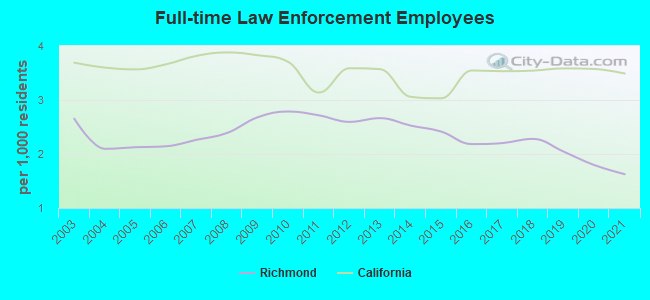
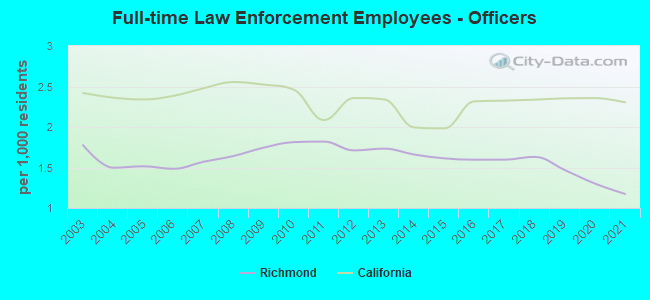
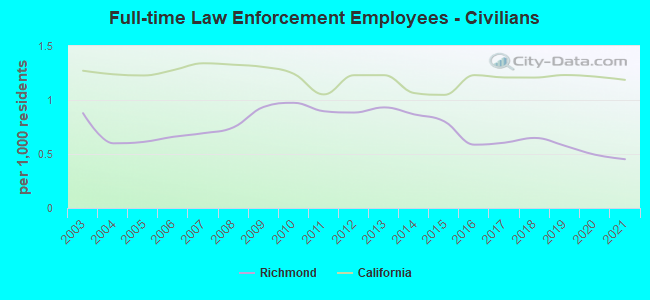
Full-time law enforcement employees in 2021, including police officers: 180 (130 officers - 104 male; 26 female).
| Officers per 1,000 residents here: | 1.17 |
| California average: | 2.30 |
Full-time law enforcement employees in 2020, including police officers: 200 (145 officers - 117 male; 28 female).
| Officers per 1,000 residents here: | 1.30 |
| California average: | 2.36 |
Full-time law enforcement employees in 2019, including police officers: 227 (163 officers - 134 male; 29 female).
| Officers per 1,000 residents here: | 1.47 |
| California average: | 2.35 |
Full-time law enforcement employees in 2018, including police officers: 253 (181 officers - 151 male; 30 female).
| Officers per 1,000 residents here: | 1.63 |
| California average: | 2.34 |
Full-time law enforcement employees in 2017, including police officers: 244 (177 officers - 149 male; 28 female).
| Officers per 1,000 residents here: | 1.60 |
| California average: | 2.32 |
Full-time law enforcement employees in 2016, including police officers: 242 (177 officers - 147 male; 30 female).
| Officers per 1,000 residents here: | 1.60 |
| California average: | 2.32 |
Full-time law enforcement employees in 2015, including police officers: 265 (177 officers - 153 male; 24 female).
| Officers per 1,000 residents here: | 1.61 |
| California average: | 1.98 |
Full-time law enforcement employees in 2014, including police officers: 274 (180 officers - 157 male; 23 female).
| Officers per 1,000 residents here: | 1.66 |
| California average: | 2.00 |
Full-time law enforcement employees in 2013, including police officers: 286 (186 officers - 162 male; 24 female).
| Officers per 1,000 residents here: | 1.73 |
| California average: | 2.34 |
Full-time law enforcement employees in 2012, including police officers: 276 (182 officers - 162 male; 20 female).
| Officers per 1,000 residents here: | 1.71 |
| California average: | 2.36 |
Full-time law enforcement employees in 2011, including police officers: 285 (191 officers - 170 male; 21 female).
| Officers per 1,000 residents here: | 1.82 |
| California average: | 2.09 |
Full-time law enforcement employees in 2010, including police officers: 289 (188 officers - 171 male; 17 female).
| Officers per 1,000 residents here: | 1.81 |
| California average: | 2.46 |
Full-time law enforcement employees in 2009, including police officers: 275 (179 officers - 164 male; 15 female).
| Officers per 1,000 residents here: | 1.75 |
| California average: | 2.52 |
Full-time law enforcement employees in 2008, including police officers: 243 (167 officers - 152 male; 15 female).
| Officers per 1,000 residents here: | 1.64 |
| California average: | 2.55 |
Full-time law enforcement employees in 2007, including police officers: 232 (161 officers - 146 male; 15 female).
| Officers per 1,000 residents here: | 1.57 |
| California average: | 2.48 |
Full-time law enforcement employees in 2006, including police officers: 221 (153 officers - 138 male; 15 female).
| Officers per 1,000 residents here: | 1.48 |
| California average: | 2.38 |
Full-time law enforcement employees in 2005, including police officers: 219 (156 officers - 141 male; 15 female).
| Officers per 1,000 residents here: | 1.51 |
| California average: | 2.34 |
Full-time law enforcement employees in 2004, including police officers: 217 (155 officers - 138 male; 17 female).
| Officers per 1,000 residents here: | 1.50 |
| California average: | 2.36 |
Full-time law enforcement employees in 2003, including police officers: 275 (184 officers - 166 male; 18 female).
| Officers per 1,000 residents here: | 1.78 |
| California average: | 2.42 |
Zip codes: 94850.